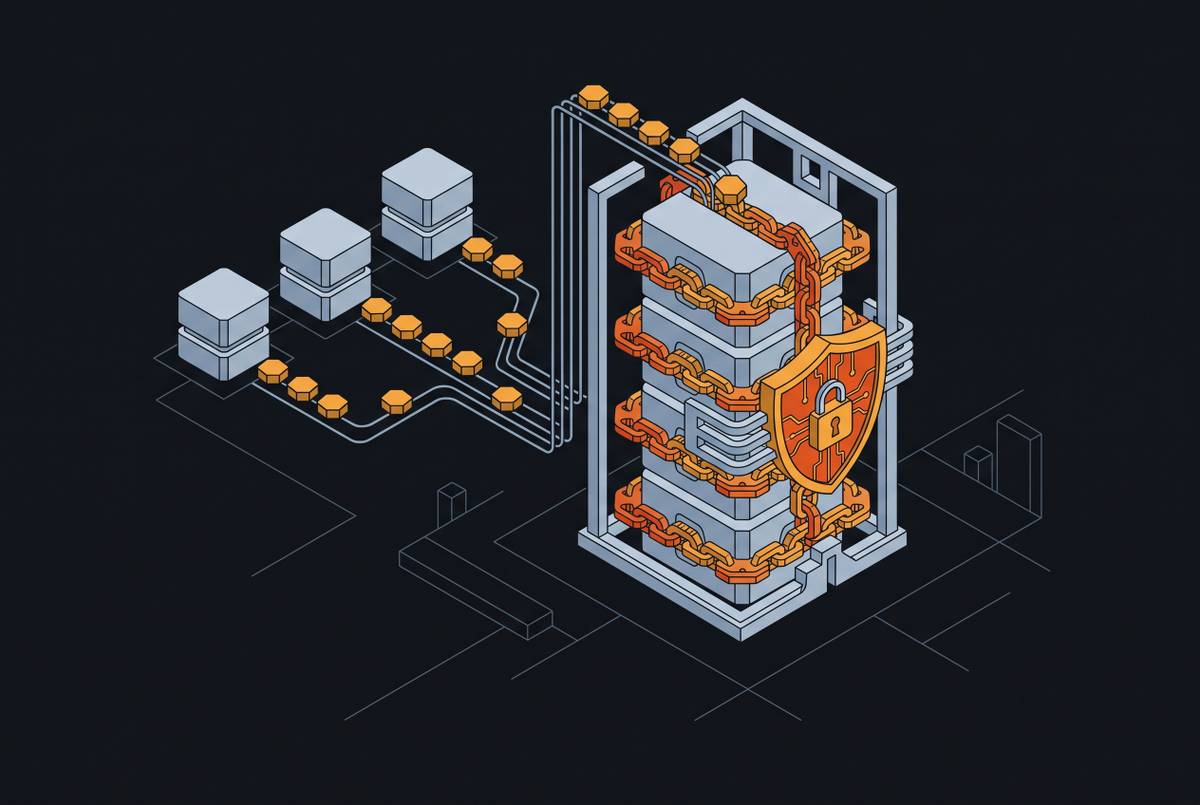
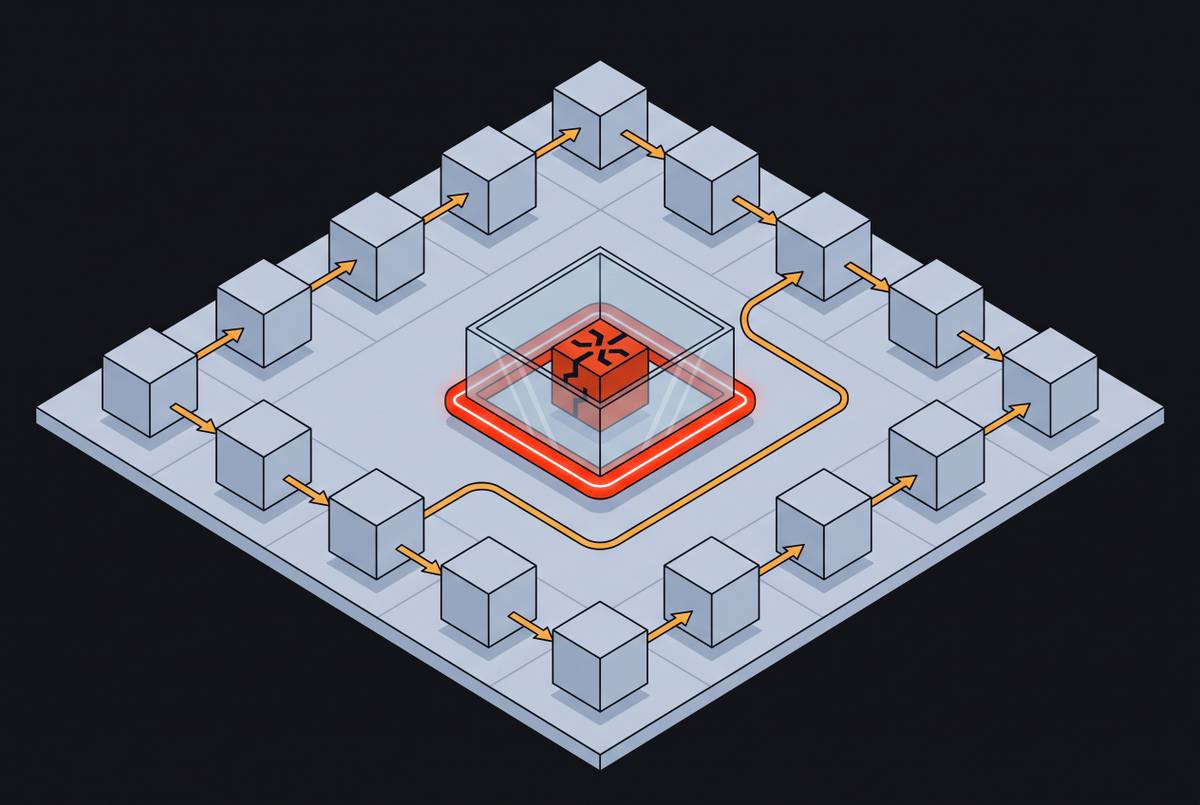
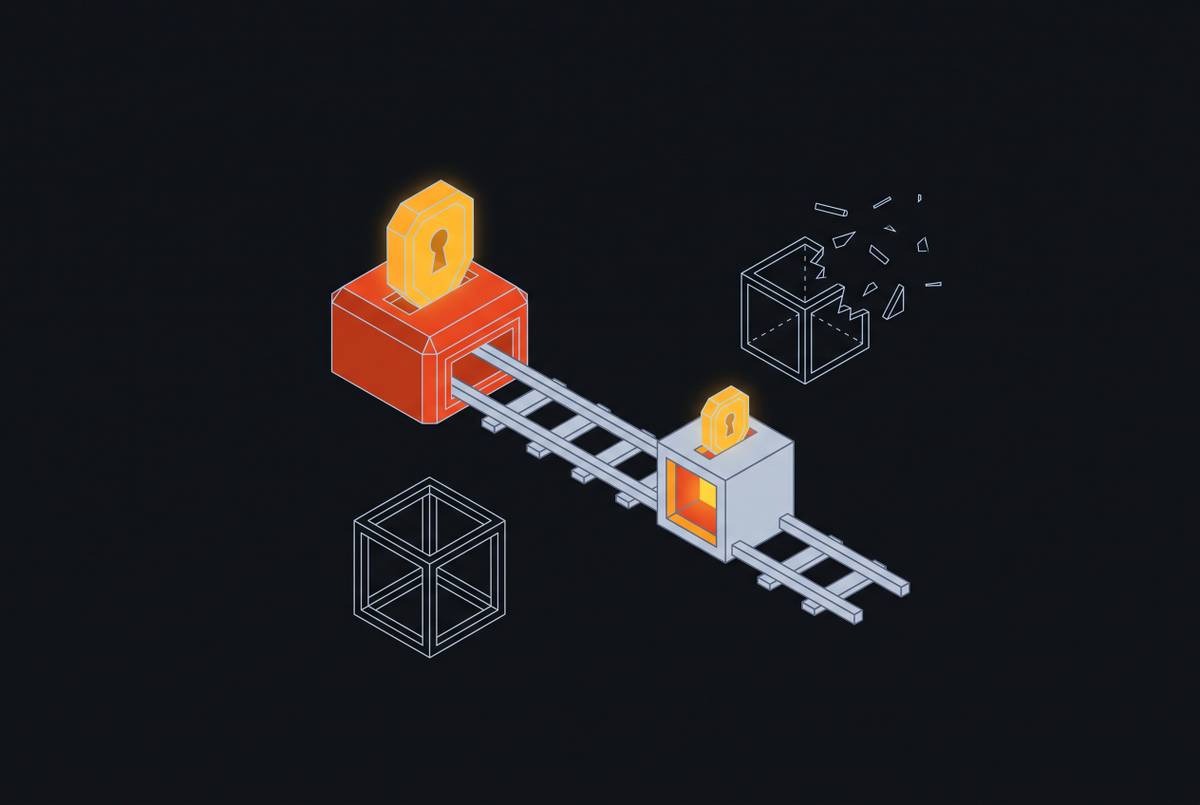
OTEL Tracing for AI Agent Session Forensics
OpenTelemetry spans reveal what AI agents decided to do, not what actually executed.
Traditional application performance monitoring rests on one assumption: the same input reliably produces the same output, so a stack trace is enough to reconstruct what happened. AI agents break that assumption at the root. Ask the same question twice and an agent may call a different tool, retrieve a different document, or reason its way to a different answer; a stack trace tells you which function ran, but nothing about why. It says nothing about why a model chose to call one tool over another, or why it decided the task was finished after three steps instead of five.
A single user request to an agent can trigger multiple LLM calls, multiple tool calls, and multiple retrieval steps, and each one is a distinct place where things can go wrong. A conventional error metric collapses all of that into a single number: the request succeeded or it failed. That number cannot locate which of the five steps inside the request actually broke, and it cannot explain why a request that looked identical to the last one took four times as long or cost ten times as much.
Cost and latency in agent systems track token counts and context window size, not request volume. Request-rate monitoring, the backbone of conventional APM dashboards, is blind to this. It watches the wrong variable.
The debug artifact itself has to change. Where a traditional engineer reaches for a stack trace, an engineer debugging an agent needs the prompt that was sent, the completion that came back, the reasoning chain the model produced, and the exact arguments passed to every tool it called. Without those four things, a failure in production is not reconstructable. It can only be guessed at.
That forensic demand goes further than what most teams mean when they say they have observability. Observability tools typically sample, capturing a representative slice of traffic rather than its entirety. Observability traces are also, by design, mutable and deletable, useful for a dashboard but useless as evidence. Observability answers "what happened, if you trust the system telling you." Forensics has to answer the harder question: what happened, if someone refuses to trust it. Most teams running agents in production have built the first thing and believe they have built the second.
The gen_ai.* span hierarchy as a causal record of an agent run
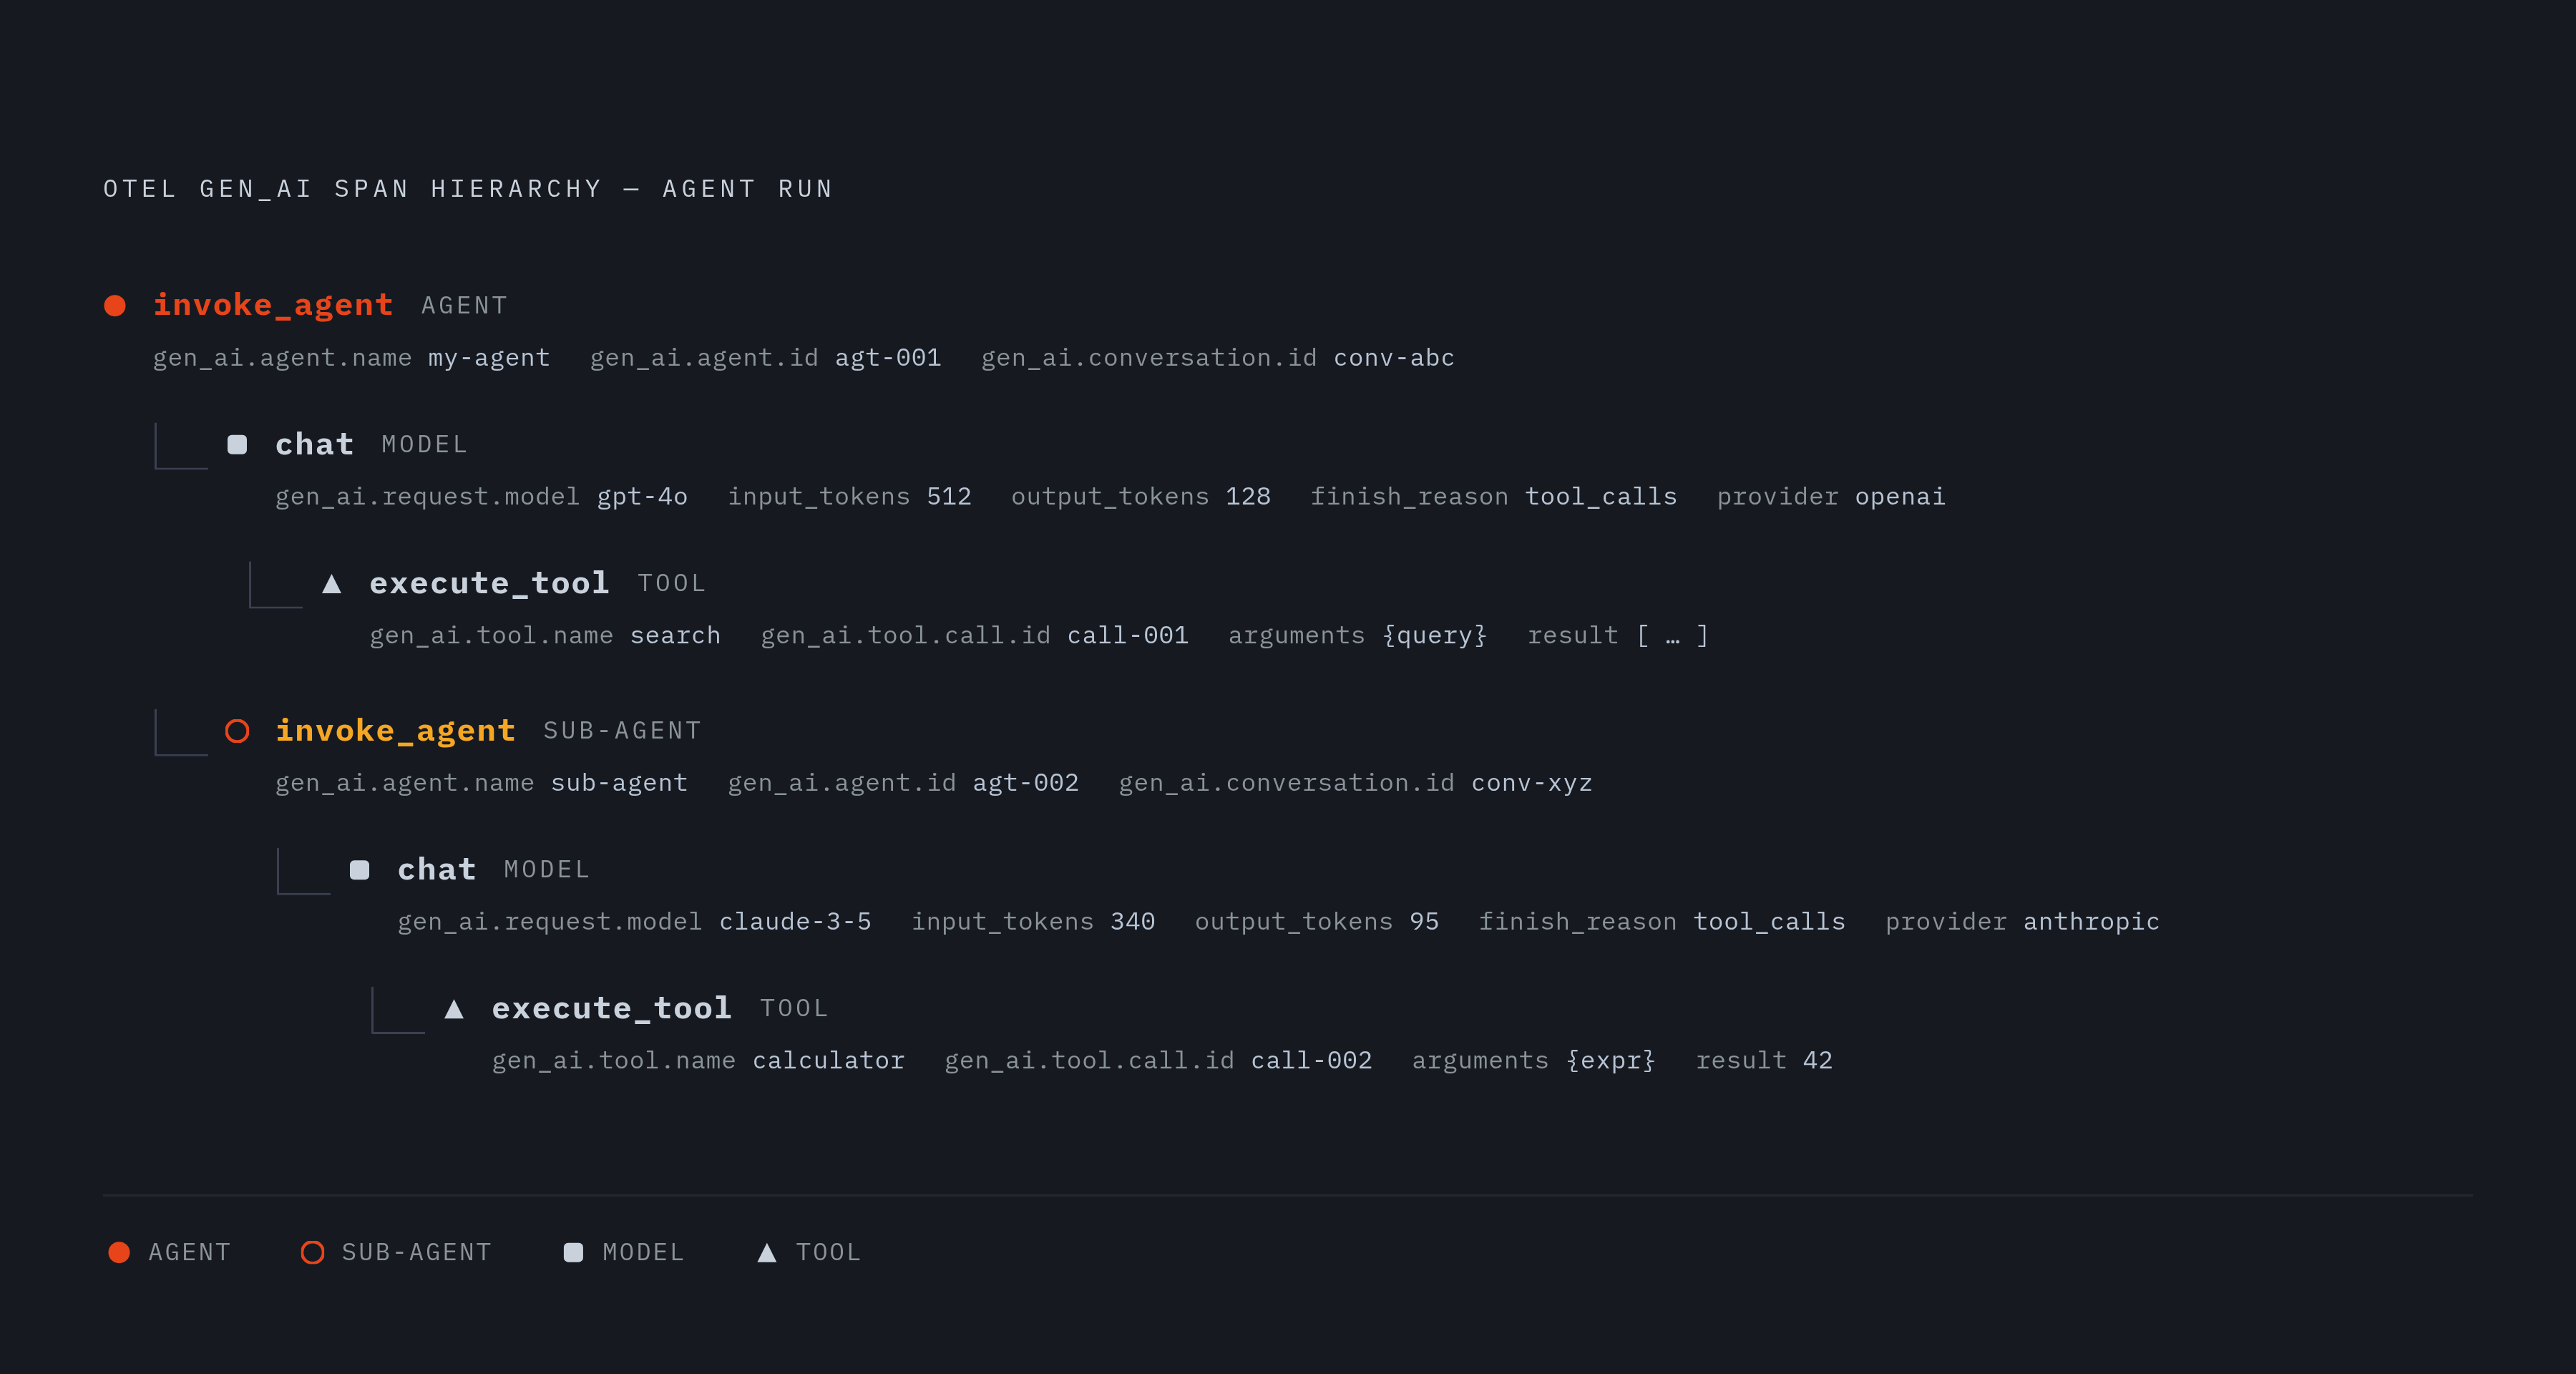
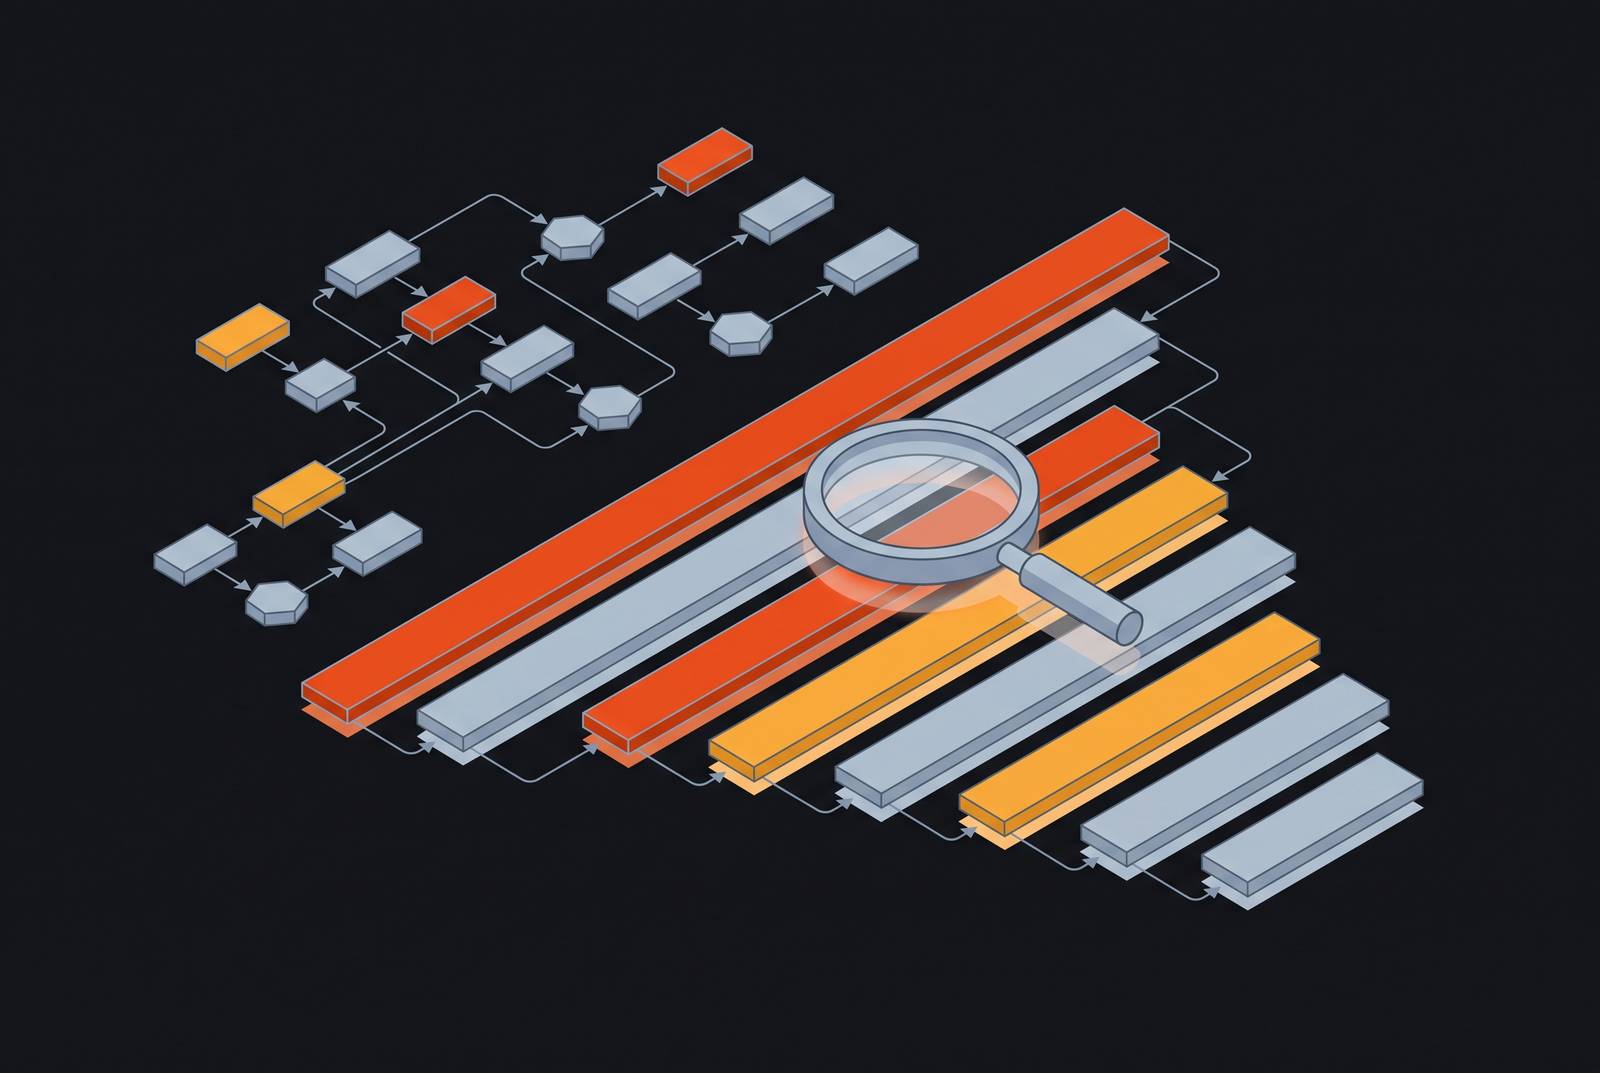
The OpenTelemetry GenAI semantic conventions, organized under the gen_ai.* namespace, exist to close exactly that gap. The span tree they produce is the full causal record of a single agent run: who called what, in what order, and what came back at each step. Three node types compose that tree.
An agent span, recorded under the operation name invoke_agent, represents the whole run, or a sub-agent nested somewhere within it. It carries gen_ai.agent.name, gen_ai.agent.id, and gen_ai.conversation.id, so you know which agent acted and within which conversation.
A model span, recorded under chat, represents a single call to an LLM. It carries gen_ai.request.model, gen_ai.usage.input_tokens, gen_ai.usage.output_tokens, gen_ai.response.finish_reasons, and gen_ai.provider.name, the attributes that let an investigator see exactly which model was asked to do what, how much it consumed doing it, and why it stopped.
A tool span, recorded under execute_tool, represents a single tool call. It carries gen_ai.tool.name and gen_ai.tool.call.id, along with the arguments passed in and the result returned, where privacy constraints allow those to be captured.
These three span types nest in a fixed pattern. One user request becomes a top-level agent span. Under it sit the model calls the agent made to reason about the request. Under each of those model calls sit the tool calls that reasoning step triggered. If the agent spawns a sub-agent partway through, that sub-agent gets its own span, with its own children nested beneath it in the same pattern. The resulting tree reads like a transcript of the agent's decision-making, laid out in the order it actually happened.
The convention's vendor-neutrality is a structural feature. Instrument an application once against the gen_ai.* attributes, and the resulting spans flow to any OTel-compatible backend without re-instrumentation. Switching observability vendors moves the trace data with it.
What auto-instrumentation captures and the execution gap it leaves open
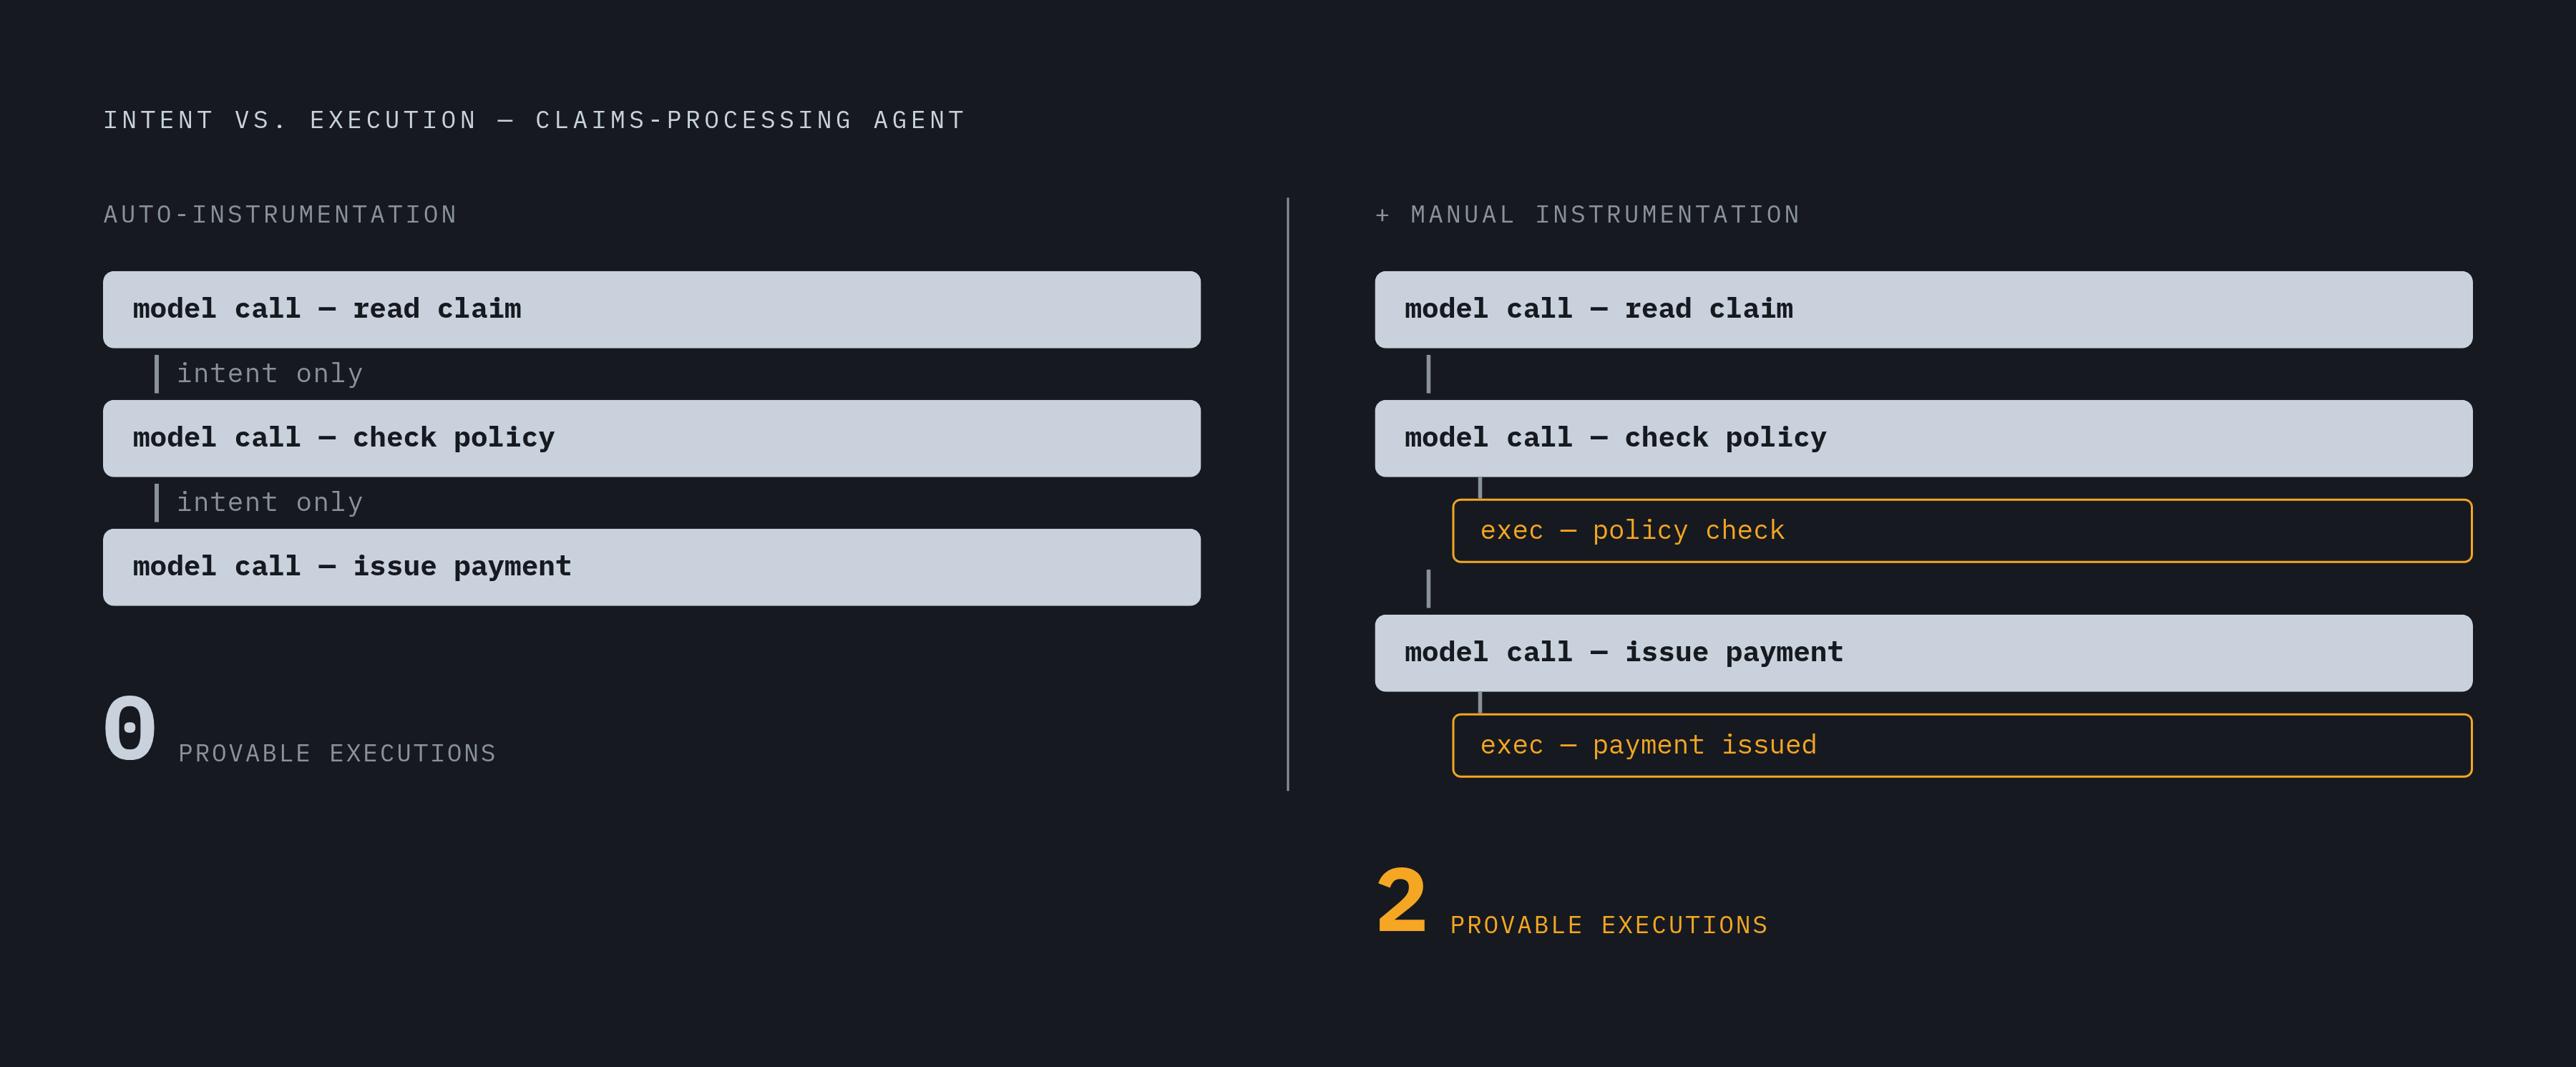
The span hierarchy above describes what a correctly instrumented trace looks like. Auto-instrumentation wraps API calls in spans without requiring custom code, but you don't get that tree by default. It traces what a model decided to do. It does not trace what was actually executed, because no auto-instrumentation package currently writes the spans that would prove execution happened.
A concrete scenario demonstrates the size of that gap. A three-step claims-processing agent read a claim file, checked it against a policy, and issued a payment. The transfer happened: the function ran, and the record of the payment exists in the downstream system. Correct manual instrumentation of the same scenario produces six spans, and raises the number of executions provably recorded in the trace from zero to two.
The OpenTelemetry spec itself anticipates this. It states that GenAI instrumentations capable of instrumenting tool execution calls should do so, unless some other instrumentation can reliably cover all the supported tool types. In practice, on both Anthropic and OpenAI, neither condition holds. The burden of writing the execution spans falls entirely on the application developer.
The consequence is a split between intent and action. Inside gen_ai.output.messages, each assistant turn carries the tool call arguments, the tool name, and the tool call id, so what the model decided to do is fully recoverable from the trace. An incident investigator reading an unaugmented trace can prove intent. They cannot prove outcome.
A second, narrower gap compounds the first. gen_ai.tool.definitions, the attribute recording the full list of tools exposed to the model at call time, appears by default on OpenAI spans but has not historically been recorded on Anthropic ones, though a fix for that asymmetry is in progress. Without tool definitions captured at the moment of the call, an investigator reconstructing an incident cannot establish what the agent was even permitted to do when it acted, only what it chose to do among options nobody recorded.
The structural fix: what manual instrumentation must add to make the tree forensically complete
Closing the execution gap is an engineering task, not a spec change, and it has three concrete parts.
Every tool execution needs its own child span, started after the model call completes and closed only after the tool actually returns a result. The gen_ai.tool.call.id on that execution span has to match the id the model emitted in its output. Provider and model name do not need to be duplicated on the execution span. They resolve by walking up the tree to the parent span that already carries them.
The tree structure itself is doing forensic work. A tool execution span with no visible parent tells an investigator a tool ran, but not which agent, which conversation, or which reasoning step caused it to run. Full retention is required there. Tail sampling remains a reasonable approach for everything else: keep every trace that contains a failure, and every trace that ran unusually slow or unusually expensive, while downsampling the large volume of uneventful, successful runs that carry little forensic value.
Three attributes remain unresolvable even with disciplined manual instrumentation, and these are gaps in the conventions themselves rather than failures of engineering effort.
gen_ai.agent.id is scoped by the spec to hosted agent resources, things like a Bedrock ARN or a GCP Agent Registry identifier, and the spec explicitly discourages recording in-memory instance ids for agents that don't have one. No amount of careful instrumentation fixes that, because the spec gives no standard slot to put a self-hosted agent's identity in.
gen_ai.conversation.id has a similar shape. The spec instructs instrumentations not to invent a conversation id when no natural identifier exists in the application. This attribute is frequently absent, and when it's absent, nothing in the trace ties a sequence of agent actions back to the business object, the claim, the order, the support ticket, that the actions were performed against.
A third gap, specific to the claims scenario rather than the conventions generally, involves the absence of a captured system prompt. That one is a property of how the scenario was built.
Why the MCP tool boundary breaks distributed traces
A further break in the trace appears at the boundary where an agent calls out to an external tool server. When that call happens, two separate traces get produced, one from the agent's side and one from the MCP server's side, with no context propagation linking them. The agent's span tree and the MCP server's span tree describe the same event, but they sit forensically disconnected from each other.
Analysis from Glama documented this precisely: the agent produces one trace, the MCP server produces a second, and nothing in the standard tooling links the two. The same disconnection appears in multi-agent architectures, where an agent's span tree runs up to the call_tool() invocation and then simply stops, while the MCP server on the other end starts an entirely new, unrelated trace of its own. IBM's mcp-context-forge project filed Issue #7094 in October 2026, documenting the identical disconnection pattern occurring in agent-to-agent (A2A) invocations.
OpenTelemetry v1.39 added MCP-specific semantic conventions designed to bridge exactly this gap, introducing attributes including mcp.method.name, mcp.session.id, and mcp.protocol.version. These give an MCP server's trace the vocabulary to describe itself in terms compatible with the calling agent's trace. Without that propagation working end to end, a forensic investigator looking at an incident cannot follow a single tool invocation from the agent's decision to call it through to what the MCP server actually did in response. The chain of evidence breaks exactly at the protocol boundary.
That boundary is not a narrow technical curiosity. MCP spread rapidly through 2025, and it brought with it a large, largely unmonitored attack surface. Research published in early 2026 documented a large and growing number of active MCP servers sitting on the public internet with no authentication. A systemic architectural flaw disclosed in April 2026 by OX Security exposed hundreds of thousands of vulnerable instances across a supply chain tied to hundreds of millions of package downloads. An unmonitored protocol boundary combined with a widely deployed, often unauthenticated server population turns the tracing gap into a security problem.
MCP-specific attack vectors that traces must be able to detect and reconstruct
A forensically complete trace is the only technical record capable of telling a legitimate tool call apart from an attack, and it can only do that if it captures the actual arguments passed to a tool, not just the tool's name. A trace that records "payment tool was called" without recording what amount, what account, and what authorization accompanied that call cannot distinguish a normal transaction from a malicious one.
The scale of active exploitation against this surface is documented by the OWASP MCP Top 10, the first OWASP framework built specifically for this attack surface.
The NSA's security advisory, published in May 2026, identified eight MCP-specific risk patterns, each one defining what a trace needs to capture to catch it.
Dynamic tool invocation, where an agent autonomously calls new tools at runtime that it wasn't necessarily provisioned with ahead of time, requires that the tool definition in force at the moment of the call be captured in the trace. Without gen_ai.tool.definitions recorded at call time, there's no way to confirm after the fact whether a tool call was within the agent's intended scope or a sign that scope had been expanded without anyone's knowledge.
Implicit trust relationships, where one agent accepts another agent's output as valid without independent verification, can only be investigated through cross-agent trace linkage, the same mcp.session.id and mcp.protocol.version propagation discussed above. Absent that linkage, there's no record connecting what one agent produced to what a second agent consumed and acted on.
Each of these risk patterns names a specific hole in the default trace, and each hole has a specific attribute or span structure that closes it.
The privacy tension that limits forensic completeness
Forensic completeness and privacy hygiene pull in opposite directions, and no amount of clever engineering eliminates that tension. The same tool arguments and model outputs that make an incident fully reconstructable are also exactly the data most likely to contain personally identifiable information, credentials, and other sensitive material that a privacy or compliance program is obligated to protect.
A trace that captures every argument passed to every tool call, in full, with no filtering, gives an investigator everything needed to reconstruct a payment, a policy check, or a data access decision down to the last detail. That same trace, stored and retained for forensic purposes, becomes a large repository of sensitive information sitting in an observability backend that was never designed or audited as a system of record for PII.
Managing that tension without giving up on either goal means treating redaction and retention as instrumentation decisions, made deliberately at the point where a span is written, rather than bolted on afterward. Fields known in advance to carry sensitive values, account numbers, authentication tokens, names tied to protected records, can be masked or hashed at write time while still preserving enough structure in the trace to prove that a tool was called with a given shape of argument, even if the exact value is not retained in plain text. Full retention stays reserved for the spans that sit in the path of consequential, irreversible actions, where the forensic value of an unredacted record outweighs the privacy cost, so everything else can be governed by shorter retention windows and tighter redaction rules. That split does not make the tension disappear. It makes the tension a deliberate design choice instead of an accident discovered during an incident review.
Sources
- OpenTelemetry for AI Systems: LLM and Agent Observability (2026)
- GitHub - Quentin-NA/agent-trace-forensics: A reproducible protocol showing that OpenTelemetry GenAI auto-instrumentation traces what a model decided, never what was executed. · GitHub
- Property-Level Reconstructability of Agent Decisions: An Anchor-Level Pilot Across Vendor SDK Adapter Regimes
- How OpenTelemetry Traces LLM Calls, Agent Reasoning, and MCP Tools
- Decision Evidence Maturity Model for Agentic AI: A Property-Level Method Specification
- MCP Security Crisis: Systemic Design Flaws in AI Agent Infrastructure
- MCP-DPT: A Defense-Placement Taxonomy and Coverage Analysis for Model Context Protocol Security